Today we continue our journey on becoming successful shop owners with the second part of Brad’s three part series on google analytics. Yesterday, we added it to your shop, and now Brad will guide you through the basics.
How Many People Visit My Site?
The default Dashboard in Google Analytics is a summary of who has visited your site in the last 30 days. This is most likely the first thing you’ll want to take a look at everyday to get a sense of how your shop is performing.
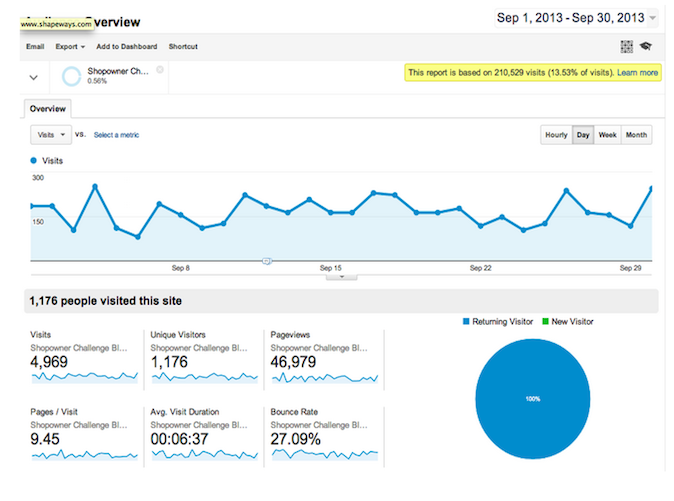
You can see a few important statistics here:
- Unique Visitors- The number of individual people that visit your shop on a daily basis (Higher is better)
- Avg. Visit Duration – How long do people spend viewing items in your shop? (Higher is better)
- Bounce Rate– How many people visit your shop and leave without viewing another page (Lower is better!)
- % New Visits – How many new users are you attracting on a daily basis (Higher is better)
You’ll see each of the above items listed out for the past 30 days by default. Clicking on each of the ‘sparklines’ will enlarge the graph, allowing you to hover over each point for more detail.
At the bottom of the large graph, you’ll see a small grey down-arrow (Screenshot needed). Clicking on this allows you to add notes on specific dates, called Annotations. At Shapeways, we like to add annotations any time we launch a feature, material, or make a change to our Product.
Annotations allow you to have a good point of reference of when you’ve uploaded a new popular Product or changed your shop’s sections, for example. If you’re looking at data from a year ago, you might not remember what happened that caused a huge spike or a dip. Think of it like leaving a note for future-you.
Who are my Customers?
Now that you can see how many people are visiting your site, you’ll want to take a closer look at who those customers are and where they’re coming from so you can find more people like them! Google Analytics provides two great reports for this.
Demographics – What country/state/city are my users from?
One of the most common requests by any Shapeways Shop Owner is to understand where in the world their products are going. Are your Drone parts being shipped to Arkansas? Does someone in Salt Lake City keep buying up GoPro adapters for their snowboard?
To view where your shoppers are from:
- Click on the Audience tab on the left side of the screen
- Click the Demographicslink under the Audience tab.
- Click the Location link.
You’ll be presented with a list of countries sorted by number of Visits in the past 30 days. You can click on each Country to drill down deeper or use the small tabs above to just view the top Cities around the globe where your customers are browsing from.
Source – How did my users find me?
Now that you know where people are physically located, you should figure out how they found you. Traditional brick and mortar shops have to hope that every customer brings up this information in conversation or requires customers to fill out a brief form including the question “How did you hear about us?” Luckily, Google Analytics tracks the ‘Referring URL’ where a user visited before clicking to your shop.
To learn how shoppers found your shop:
- Click on the Acquisition tab on the left side of the screen.
- Click the Channels link under the Acquisition tab.
The Channels report gives you a breakdown of how people found you, split into the following categories:
- Direct – Typed in your URL directly or have your site bookmarked.
- Referral – Found your shop through another site like a forum or blog.
- E-mail – Clicked on a link in an E-mail from you or from Shapeways.
- Organic Search – Found your shop by searching Google/Bing/etc. and clicking on organic (non-paid) search results.
- Paid Search – Found your shop by searching Google/Bing/etc. and clicking on the Paid/Promoted search keywords.
- Display – Found your shop by clicking on a banner ad somewhere around the web.
Note: In some cases you’ll see entries like (other) which means Google Analytics was unable to track the referring URL. Generally this is for a small percentage of users and can be ignored.
So now you have the data, what can you do with it?
Referral traffic is very actionable and can help you grow your customer-base or discover customer feedback on your products. Check your top Referral sources and look for forums, blogs, or other places where you can reach out and talk to real people.
Search traffic can help you see what people actually typed in to find your products. You may be creating a cup holder called “Awesome cat Cup Holder” and users may be searching “Cat Coasters” for example. This could help you name your future products and potentially help you update your descriptions based on what people are searching so more people find you. You can find more information about Search in
Kate’s blog post on SEO.
Paid Search and Display traffic can be useful if you decide to buy Ads via Google, Facebook or another platform to drive more traffic to your products.
Which of my Products get the most traffic?
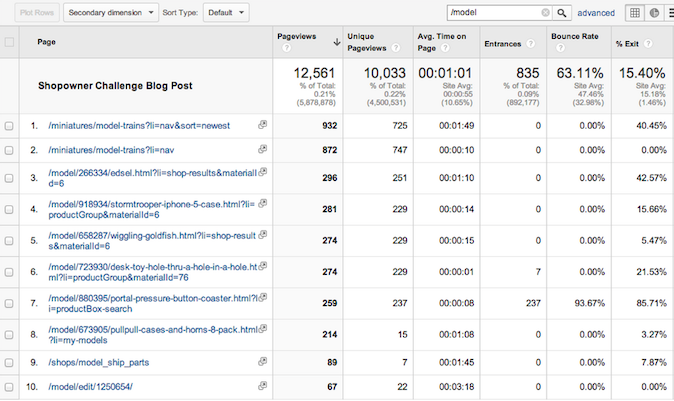
Shapeways’ automated sales reports help you understand which of your products are selling, but what about the ones that people are finding but not purchasing? We can use Google Analytics to see what pages people visiting your shop are accessing and how often.
Click on the Behavior tab on the left side of the screen.
Click on the Site Content link under the Behavior tab.
Click on the All Pages link under Site Content.
This report lists all of the pages visitors have browsed within your shop, and should give you a clear picture of which of your products are the most popular. This report becomes especially useful when combined with an Advanced Segment (see below) that filters out specific traffic sources. You could see, for example, what products visitors from a specific blog viewed to help you understand what types of products that audience likes.
Coming soon: Netfabb tutorial, advanced google analytics, pr tips, merchandising and more! What’s your favorite day of the Shop Owner Challenge so far?


This was a big one for me, frankly I had just been avoiding it – now I feel enlightened and ready to take it on.
Keep them coming.